Business Intelligence (BI) is the process of collecting, analyzing, and visualizing data to support informed decision-making, improve efficiency, and identify trends. BI is useful for tracking portfolio performance, assessing investment risks, and optimizing deal sourcing by leveraging data-driven insights.
GP Portal offers a variety of these visualizations for internal (GP) admin that are powered by uploaded data. If you need to upload a dataset, see our article on how to use Analytics for more information.
To configure which visualizations are shown:
- Navigate to Analytics in the left navigation menu.
- Click Configure Charts at the top right.
- In the Configure Charts modal, select the GP Charts tab at the top to configure GP charts, or the LP Charts to configure LP charts.
- Check/uncheck the visualizations you wish to show/hide.
- Click Save at the top right.
Visualization Types
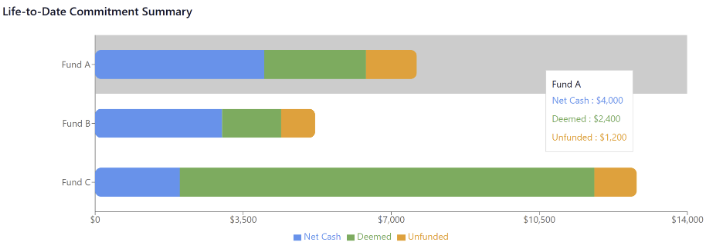
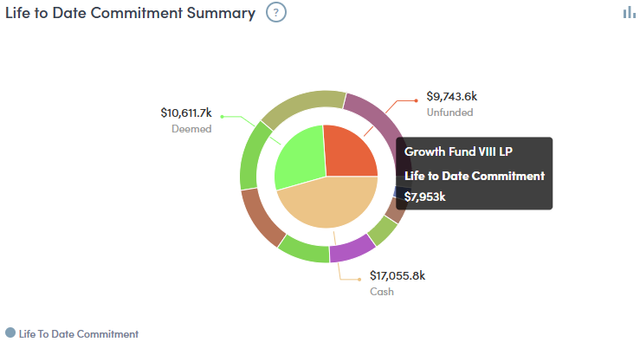
Life-to-Date (LTD) Commitment Summary
An overview of the total and remaining amounts of capital pledged/owed to a private fund. Available as both a bar and pie chart.
Bar:
Pie:
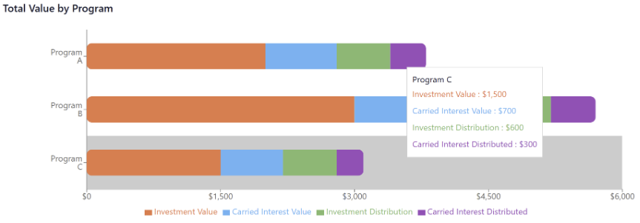
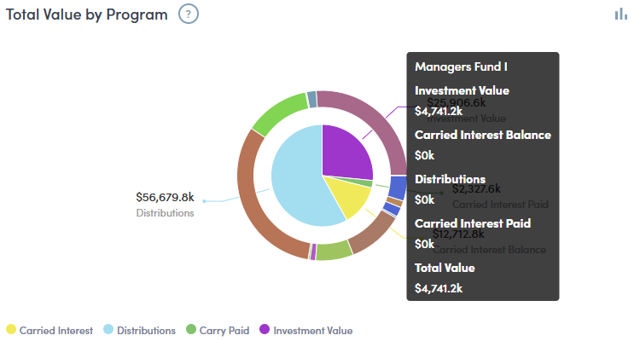
Total Value by Program
An overview of a Partner’s total market value organized by fund. Available as both a bar and pie chart.
Bar:
Pie:
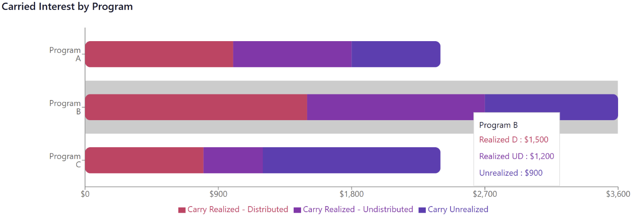
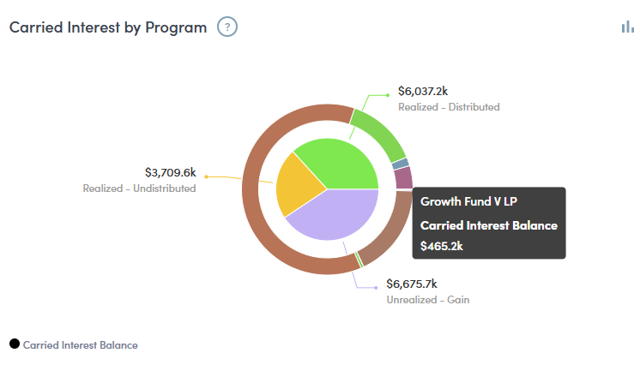
Carried Interest by Program
An overview of a Partner’s carried interest organized by fund. Available as both a bar and pie chart.
Bar:
Pie:
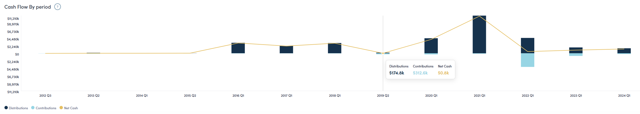
Cash Flow By Period
A series of cashflows paid/received by the Partner organized by date.