Business Intelligence (BI) is the process of collecting, analyzing, and visualizing data to support informed decision-making, improve efficiency, and identify trends. BI is useful for tracking portfolio performance, assessing investment risks, and optimizing deal sourcing by leveraging data-driven insights.
GP Portal offers a variety of these visualizations for external (LP) users that are powered by data uploaded by internal users of the portal. What visuals are shown is configured by the portal’s internal users.
Snapshot Metrics
Within the visualizations section (below Your Dashboard), you’ll see three values:
- Total Commitment: The total amount pledged/owed across funds.
- Total Value: A snapshot of the current total value of your investments.
- Total Carried Interest: A total of all carried interest across funds.
Visualization Types
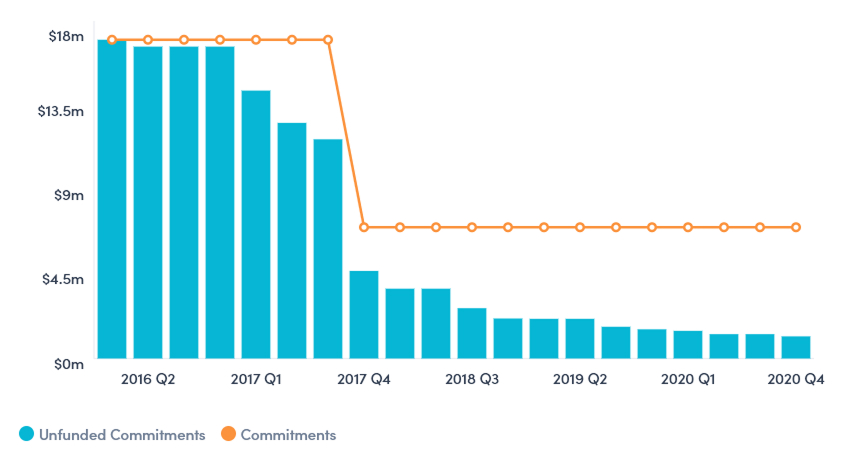
Commitment Summary
An overview of the total and remaining amounts of capital pledged/owed to a private fund.
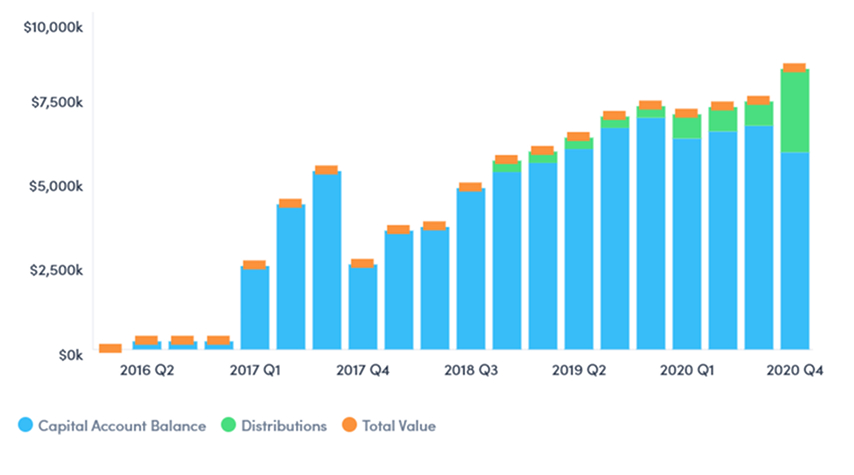
Total Value
An overview of a Partner’s total market value plus any capital distributions received.
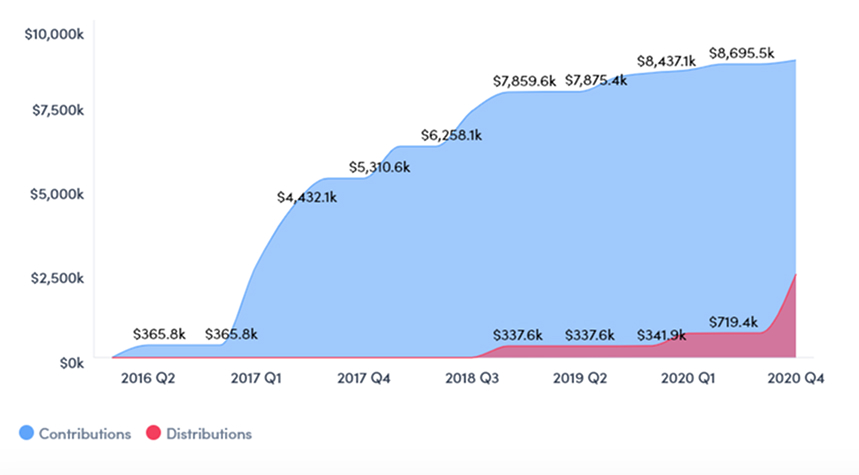
Cash Flow Summary
A series of cashflows paid/received by the Partner organized by date and capital event.
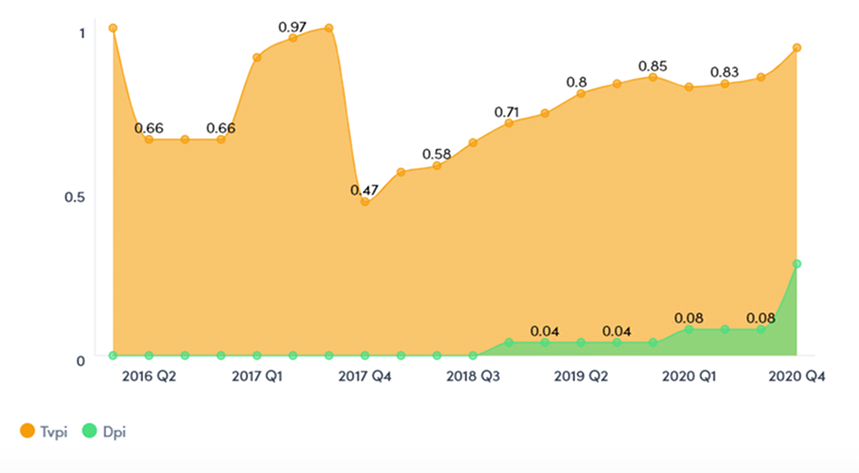
Ratio Analysis
TVPI: The ratio of a Partner’s total market value, plus the value of all capital distributions, relative to the total amount of capital paid.
DPI: The ratio of all capital distributions to a Partner, relative to the total amount of capital paid.
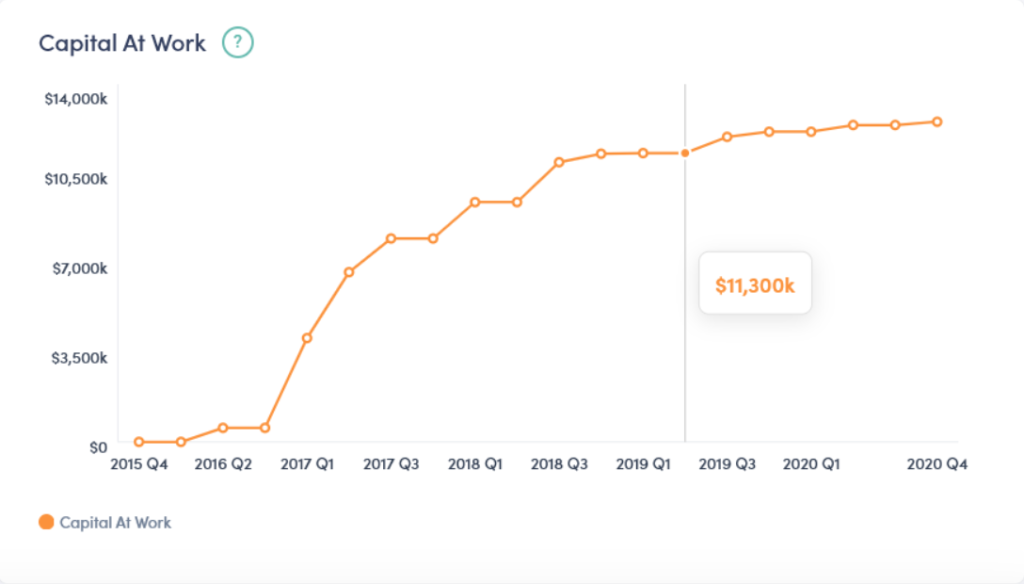
Capital At Work
An overview of the amount of capital that has been deployed over time.